AI Video Analytics Heatmap Tools India 2026: The Ultimate Guide to Watch Time Optimization
Estimated reading time: ~10 minutes
Key Takeaways
- AI-powered viewer attention heatmaps reveal hotspots, cold zones, and rewatch spikes that drive smarter edits.
- Predictive video performance lets creators forecast retention before publishing and localize content for Indian audiences.
- A robust video analytics dashboard tracks hooks, retention zones, vernacular impact, and privacy-compliant metrics.
- Studio by TrueFan AI closes the loop from insights to action with rapid variant generation and 175+ language localization.
- Align with India’s DPDP by centering consent, minimizing data, and using secure, compliant platforms.
In the hyper-competitive digital landscape of 2026, the battle for attention is no longer won by simply “going viral.” For Indian creators and brands, the metric of truth has shifted from vanity views to deep retention. Navigating this shift requires sophisticated AI video analytics heatmap tools India 2026, which allow marketers to see exactly where a viewer’s eyes linger and where their interest fades. As the Indian creator economy matures, understanding the “why” behind every skip and rewatch has become the baseline for survival.
The integration of artificial intelligence into video analytics has transformed raw data into a visual roadmap. By leveraging viewer attention heatmap video technology, creators can now identify “hotspots” of high engagement and “cold zones” where audiences drop off. This guide explores the frameworks, tools, and predictive models that are defining video success in India this year.
1. The 2026 Landscape: Why Heatmaps are the New Currency of Content
By 2026, the global AI video analytics market is projected to reach USD 6.19 billion, growing at a staggering CAGR of 22.74% through 2031. In India, this growth is accelerated by the rapid digitalization of retail, warehouse management, and smart city infrastructure, which has trickled down into the creator tools ecosystem. Indian creators are no longer just making videos; they are managing data-driven assets.
Defining the Heatmap in 2026
A video retention heatmap is a visual overlay that maps the percentage of viewers remaining at each second of a video. Unlike traditional graphs, 2026-era heatmaps use AI to correlate these drops with specific on-screen elements—such as a specific b-roll clip, a change in audio frequency, or the appearance of a CTA.
Key Market Signals in India:
- Enterprise Maturity: Platforms like TechnologyCounter India now list heatmap analytics as a core requirement for video software, signaling that visual data is now a mainstream expectation.
- Operational Parity: As highlighted by Express Computer, AI video analytics are transforming warehouse visibility in India. This same logic of “anomaly detection”—finding the exact moment a process (or a video) fails—is now being applied by growth hackers to optimize YouTube watch time.
- Retail Influence: ITG India has pioneered the use of retail heatmaps for queue detection and customer counting. This enterprise-grade visual intelligence is the foundation upon which modern video retention heatmap tools are built.
Solutions like Studio by TrueFan AI demonstrate ROI through their ability to bridge the gap between these analytical insights and high-quality content production, allowing creators to act on data in real-time.
Sources:
- Mordor Intelligence: AI Video Analytics Market Report
- TechnologyCounter: Video Analytics Software India
- Express Computer: AI Video Analytics in Indian Warehouses 2026
2. Decoding the Heatmap: Reading and Acting on Retention
Understanding a viewer attention heatmap video is the first step toward watch time optimization AI India. For a creator in Mumbai or Bangalore, a heatmap isn't just a colorful line; it’s a transcript of the audience’s subconscious.
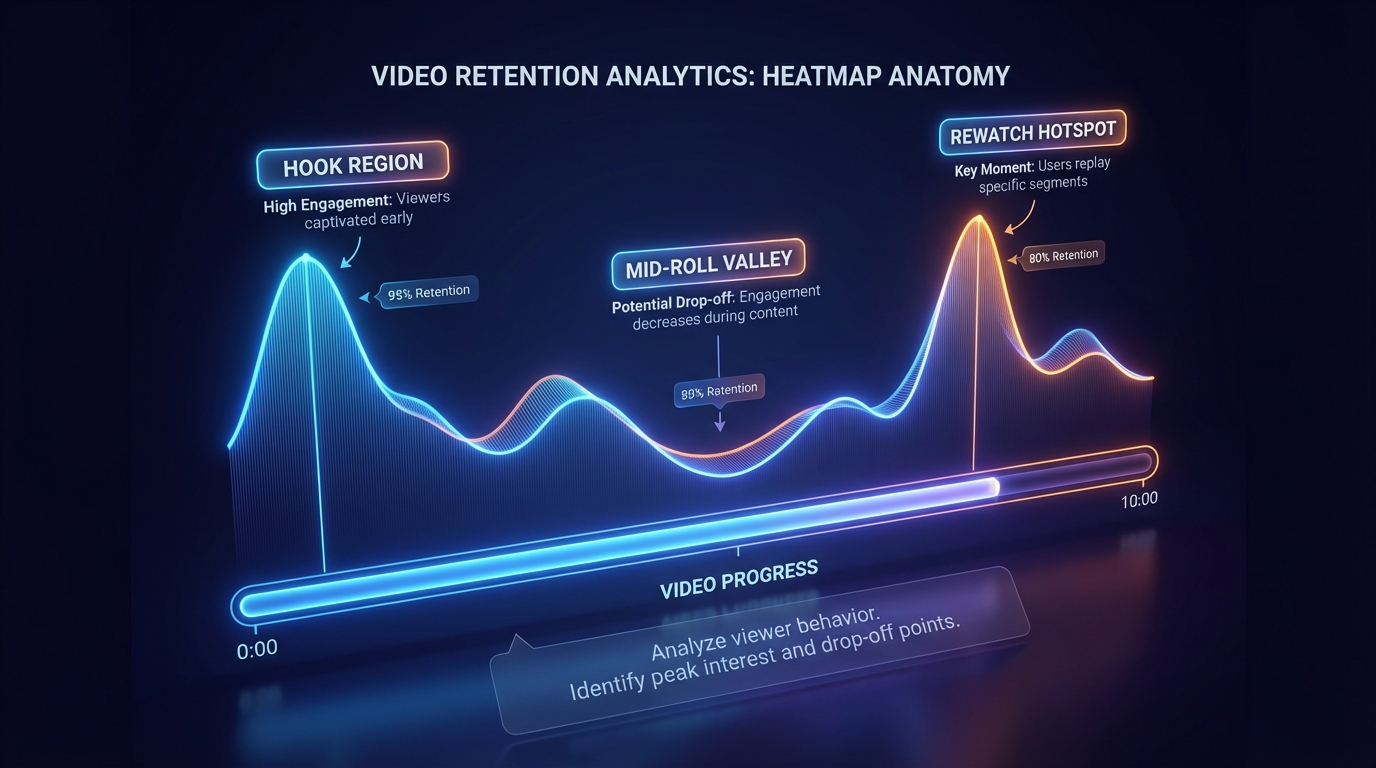
The Anatomy of a High-Performing Heatmap
- The Hook Region (0–30s): See the Mobile-First Video Hooks Strategy. In 2026, the “cliff” is steeper than ever. AI tools now flag “early exits” if more than 15% of the audience leaves within the first 10 seconds. A successful heatmap shows a “curiosity loop” spike here, where viewers rewatch the intro to catch a detail they missed.
- Mid-Roll Valleys: These are segments where pacing slows down. If your heatmap shows a steady decline during a technical explanation, it’s a signal to insert a “pattern interrupt”—a visual change, a sound effect, or a shift in camera angle.
- The Rewatch Hotspot: This is the “gold” of video analytics. A spike in the heatmap indicates a moment so valuable or entertaining that viewers went back to see it again. These segments should be immediately clipped and repurposed as Shorts (YouTube Shorts editor for Android in India) or Reels.
Practical Fixes for Indian Creators
If your YouTube watch time analytics AI flags a drop-off during a vernacular segment, consider the Caption Strategy. Indian audiences are increasingly multi-lingual; adding dynamic, emoji-rich captions in Hindi or Tamil (AI voice cloning for Indian accents) during complex segments can stabilize the retention curve.
Pro-Tip: If your end-screen CTR is low and the heatmap shows a dip right before the CTA, move your “soft CTA” to the 50% mark of the video. This ensures that even those who leave early have been exposed to your primary goal.
3. Finding and Fixing Drop-Offs with AI Behavioral Signals
A video drop-off analysis AI does more than just show you where people leave; it tells you who is leaving and why. In 2026, AI viewer behavior analysis has moved into “clustering.” This means the AI can tell you if your “tech-savvy” audience stayed while your “beginner” audience dropped off during a specific segment.
Identifying the “Red Flag” Patterns
- The Early Cliff: A sharp vertical drop at the start. Cause: The thumbnail/title promised something the intro didn't deliver. Fix: Align the first 5 seconds of the script exactly with the thumbnail’s hook.
- The Transition Dip: A drop every time you switch topics. Cause: Weak “bridge” sentences. Fix: Use “open loops”—mention what’s coming next before finishing the current point.
- The CTA Slide: A gradual decline as soon as you say “In conclusion.” Cause: The viewer feels the value is over. Fix: Save one “bonus tip” for after the CTA to keep them watching until the very last second.
Attention Tracking Video Content
Modern attention tracking video content tools use eye-tracking simulations to predict which parts of your frame are drawing focus. If your heatmap shows a drop while you’re showing a complex chart, the AI might suggest that the text density is too high for mobile viewers in India, who often consume content on the go in high-glare environments. Muted autoplay video creation tips
Sources:
- ITG India: Retail Heatmaps and Visual Intelligence
- Vizo361: Best AI Video Analytics Companies in India
4. The Prediction Layer: Forecasting Success Before You Hit Publish
The most significant advancement in AI video analytics heatmap tools India 2026 is the shift from reactive to proactive analysis. Predictive video performance AI now allows creators to “score” their videos before they are even uploaded.
Engagement Scoring for the Modern Creator
An engagement scoring AI video creator workflow involves feeding your raw edit, thumbnail, and script into a model that compares it against millions of hours of similar content. The result is a “Predictive Retention Curve.”
Inputs to the 2026 Predictive Models:
- Creative Features: Shot length, subtitle density, and even the “energy level” of the presenter’s voice.
- Contextual Factors: Publish time windows optimized for specific Indian regions (e.g., targeting the 8 PM peak for urban professionals in Delhi).
- Historical Cohorts: How your specific audience has reacted to similar “hooks” in the past.
Studio by TrueFan AI's 175+ language support and AI avatars allow brands to operationalize these predictions. If the AI predicts a low engagement score for a generic English hook in the South Indian market, the platform can rapidly generate a localized Tamil version with a high-energy AI avatar to boost the predicted score.
This “Prediction-First” approach reduces the “trial and error” phase of content creation, ensuring that every video uploaded has a statistically high probability of hitting its watch time goals.
5. Building the Ultimate Video Analytics Dashboard
To manage these insights, you need a centralized video analytics dashboard creator. In 2026, a simple spreadsheet isn't enough. Your dashboard must aggregate engagement metrics AI video India across YouTube, Instagram, and WhatsApp.
Must-Have Widgets for Your 2026 Dashboard
- The Hook Score (0–10): A metric derived from the first 30 seconds of retention.
- Retention Zone Matrix: Breaking the video into 0-30s, 30-60s, and 60s+ segments to identify where the “leak” is.
- CTR vs. AVD Heatmap: A scatter plot showing which thumbnails bring in “high-retention” viewers versus “click-and-quit” viewers.
- Vernacular Performance Index: Comparing how Hindi vs. English vs. Regional captions affect the total watch time.
Compliance and Data Privacy (DPDP 2026)
As Indian creators scale, they must align with the Digital Personal Data Protection (DPDP) Act. When building your dashboard, ensure that:
- Consent is Central: Any personalized video analytics must respect viewer privacy.
- Data Minimization: Only collect the metrics necessary for content optimization video AI.
- Security: Use platforms that are ISO 27001 or SOC 2 compliant to handle audience data.
Sources:
6. The 2026 Toolstack: Build vs. Buy
Choosing the right AI video analytics heatmap tools India 2026 depends on your scale. For individual creators, native tools supplemented by AI add-ons are sufficient. For enterprises, a custom-built dashboard integrated with production APIs is the standard.
The “Buy” Path: Ready-to-Use Platforms
Platforms like Studio by TrueFan AI enable creators to not only analyze but also generate the fixes. If your analytics show a drop-off, you can use the platform to swap out a hook or localize a segment in minutes. This creates a “closed-loop” where data directly informs the next edit.
The “Build” Path: Custom Dashboards
For those with technical resources, building a custom video analytics dashboard creator using Google Data Studio or Notion, powered by YouTube API exports, allows for deeper “cohort analysis.” You can tag videos by “Topic,” “Presenter,” or “Edit Style” to see long-term trends that native analytics might miss.
Implementation Guide: Step-by-Step
- Baseline (Week 1): Export the retention curves of your last 20 videos. Calculate your average “First-30s Retention.”
- Diagnose (Week 2): Use AI viewer behavior analysis to identify the “valleys.” Is it a sound issue? A boring visual? Tag these moments.
- Predict (Week 3): Before your next edit, run your script through a video engagement prediction tool. Adjust the hook based on the score.
- Act (Week 4): Publish two versions (A/B test) with different hooks. Use the heatmap to see which one held the audience longer. Harness YouTube Shorts automation with AI
7. FAQs: Mastering Video Analytics in 2026
Q1: How do I read a retention heatmap without being a data scientist?
Look for three things: the “Cliff” (start), the “Plateau” (middle), and the “Spike” (rewatches). If the line is flat, you’re doing great. If it’s a slide, you need more “pattern interrupts” like b-roll or text overlays.
Q2: What is a “good” hook score in 2026 for Indian creators?
On YouTube, retaining 70% of your audience after the first 30 seconds is considered elite. For Instagram Reels, you want 85% retention after the first 3 seconds.
Q3: How does predictive video performance AI actually work?
It uses “Computer Vision” to analyze your video frame-by-frame. It looks at the colors, the movement, and the pacing, then compares it to a database of high-performing videos in the same niche to predict where people will get bored.
Q4: Can I use these tools for regional Indian languages like Marathi or Bengali?
Yes. In fact, Studio by TrueFan AI's 175+ language support and AI avatars make it one of the few platforms that can accurately predict and optimize engagement for the “Bharat” audience, not just the English-speaking urban centers.
Q5: Is my data safe with these AI tools under India's DPDP Act?
Most reputable AI video analytics heatmap tools India 2026 are now built with “Privacy by Design.” Always check for SOC 2 compliance and ensure the tool doesn't store PII (Personally Identifiable Information) of your viewers without explicit consent.
Q6: What is the most common mistake when using heatmaps?
Over-editing. Sometimes a “dip” is just a natural transition. Don't try to make every second a “spike.” Focus on fixing the “cliffs” where you lose more than 10% of your audience in under 5 seconds.
The Future of Video Analytics
As we move further into 2026, the line between “content creation” and “data science” will continue to blur. The winners will be those who use video retention heatmap tools not just to see what happened, but to predict what will happen. By integrating predictive video performance AI into your workflow today, you are future-proofing your channel against the ever-evolving algorithms of tomorrow.
Final Toolkit Summary:
- For Analysis: YouTube Native + AI viewer behavior analysis plugins.
- For Prediction: Predictive video performance AI scoring models.
- For Action: Studio by TrueFan AI for rapid variant generation and localization.
- For Tracking: A custom video analytics dashboard creator aligned with DPDP.
Sources:
- SourceForge: Video Analytics Software India
- Slashdot: Top Video Analytics Tools in India
- TrueFan AI: AI Video Analytics Trends 2025-2026
India-Specific Performance Targets
To succeed in the Indian market, technical teams must optimize for varied network conditions:
- Edge Placement: Deploy TURN (Traversal Using Relays around NAT) servers in Mumbai, Delhi, and Chennai to minimize round-trip time.
- Adaptive Bitrate (ABR): The system must automatically downscale video quality if a user is on a congested 4G network in a Tier-3 town, prioritizing audio clarity over 4K resolution. Video optimization for low bandwidth
- Barge-in Logic: In India’s often noisy environments, the AI must distinguish between background noise and a user’s intent to interrupt.
Recommended Internal Links
- Mobile-First Video Hooks Strategy for India 2026 Success
- Muted Autoplay Video Creation: AI Strategies for India 2026
- Video Optimization Low Bandwidth: AI Tools for India 2026
- Harnessing YouTube Shorts Automation AI
- AI Voice Cloning Indian Accents: Scale Multilingual Content with Authenticity
- YouTube Shorts editor Android India: Budget AI picks
Frequently Asked Questions
How do I read a retention heatmap without being a data scientist?
Focus on three zones: the Cliff (first seconds), the Plateau (mid), and the Spike (rewatches). Flat lines are good; steady slides need pattern interrupts like b-roll, on-screen text, and sound changes.
What is a good hook score in 2026 for Indian creators?
Aim for 70% retention after 30 seconds on YouTube. For Instagram Reels, target 85% retention after the first 3 seconds to stay competitive.
How does predictive video performance AI work?
It uses computer vision and historical benchmarks to analyze frames, pacing, motion, and color, then predicts likely drop-offs to suggest edits that improve retention.
Can these tools support regional Indian languages like Marathi or Bengali?
Yes. Platforms like Studio by TrueFan AI offer 175+ languages and AI avatars to localize hooks, captions, and delivery for Bharat audiences.
Are these AI tools compliant with India’s DPDP Act?
Choose vendors with Privacy by Design, SOC 2/ISO 27001 certifications, and clear consent flows. Avoid storing viewer PII unless explicit consent is obtained and logged.