AI video analytics heatmap tools India 2026: Watch time optimization, drop‑off heatmaps, and predictive engagement for creators and enterprises
Estimated reading time: ~13 minutes
Key Takeaways
- Heatmaps reveal precise viewer attention so you can identify hooks, cold zones, and rewatch spikes.
- Predictive analytics estimates watch time, hook strength, and thumbnail CTR before publishing.
- A unified Indian stack combines dashboards, APIs, and DPDPA compliance for creators and enterprises.
- Watch time optimization requires iterative A/B testing of hooks, pattern interrupts, and localized variants.
- Tools like Studio by TrueFan AI help scale regional versions to improve retention.
In the hyper-competitive digital landscape of 2026, Indian creators and brand teams are facing a critical ROI gap between the moment a video is uploaded and the moment actionable insights are gathered. Traditional metrics like “total views” or “likes” have become vanity indicators that fail to explain why a viewer left at the 12-second mark. To solve this, AI video analytics heatmap tools India 2026 have emerged as the gold standard for content intelligence. These tools do more than just track clicks; they reveal precise viewer attention patterns, identify drop-off triggers, and predict engagement levels before a video even goes live. By leveraging watch time optimization AI India 2026, enterprises can now transform passive data into a roadmap for viral retention and sustained audience growth.
1. What is a video attention heatmap and why it matters in India (2026)
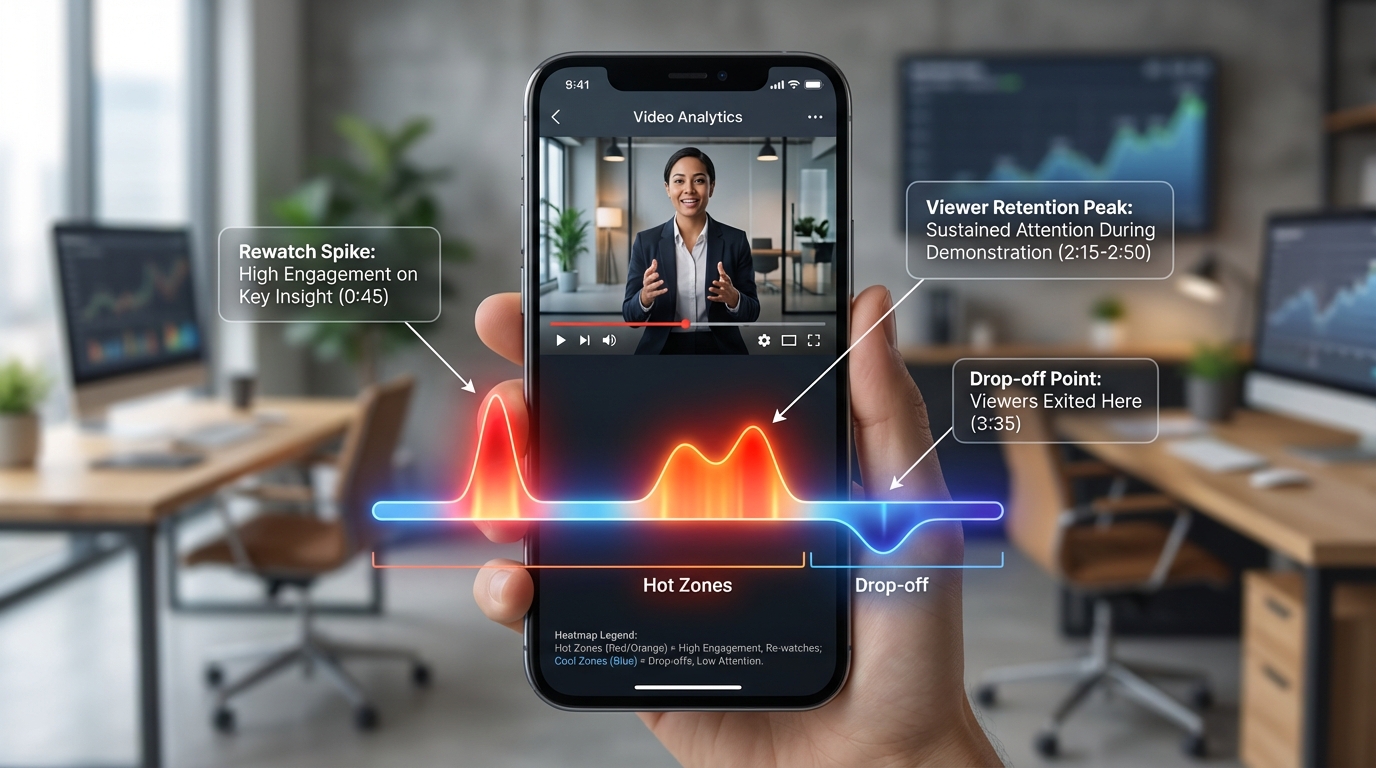
In 2026, the definition of a viewer attention heatmap video creator has evolved from a luxury feature to a fundamental necessity. A video attention heatmap explained in our guide is a visual overlay that runs along the video timeline, using color-coded gradients to show the intensity of viewer focus. “Hot” zones (bright red or orange) indicate segments where viewers are most engaged, frequently rewatching, or pausing to absorb details. Conversely, “cool” zones (blue or green) highlight areas where viewers are skipping or losing interest.
For the Indian market, attention tracking video content must account for a unique set of variables. With 92% of Indian video consumption occurring on mobile devices in 2026, the “thumb-stop” window has shrunk to less than 1.5 seconds. A video retention heatmap India shows if Hinglish transitions and cultural cues land and whether specific pattern interrupts are actually working.
The maturity of this technology in India is rooted in the physical world. For years, retail giants have used heatmap-driven video analytics for queue detection and customer movement mapping. Platforms like Studio by TrueFan AI enable creators to apply this same level of rigorous, data-driven analysis to digital content, ensuring that every frame serves a purpose. According to recent market data, Indian adoption of real-time video heatmaps in the retail sector has paved the way for sophisticated content analytics stacks that are now being democratized for individual creators and SMEs.
Sources:
- ITG India: Retail Store Video Analytics and Heatmaps
- Express Computer: AI Video Analytics Transformation 2026
2. Core capabilities creators and enterprises need in AI video analytics
To achieve content optimization video AI India, a diagnostic layer is required to break down the viewer’s journey into granular data points. This involves three primary pillars of analysis:
Video drop‑off analysis AI tools
Modern video drop-off analysis AI tools go beyond identifying where people leave; they use machine learning to correlate drop-offs with specific on-screen events. For instance, if an AI detects a 15% audience loss exactly when a creator transitions from a “hook” to a “sponsor segment,” it flags that transition as a friction point. In 2026, these tools provide:
- First 30-Second Curve Analysis: A deep dive into the most volatile part of the video.
- Segment-Level Retention vs. Baseline: Comparing your current video against the average retention of your last 50 uploads.
- Drop-off Clusters: Identifying if specific network regions (e.g., Tier 3 cities with lower bandwidth) are experiencing higher drop-offs, suggesting a need for better compression or simpler visuals.
Engagement metrics AI video creator
An engagement metrics AI video creator uses a composite scoring system. Instead of looking at “likes” in isolation, it calculates an “Engagement Velocity Score.” This score factors in watch duration, completion rates, rewatch density, and comment sentiment. By 2026, engagement scoring AI video India has become the primary KPI for brand deals, as it proves the “depth” of the audience’s connection rather than just the “breadth” of the reach.
AI viewer behavior analysis YouTube
For those focused on the world’s largest video platform, AI viewer behavior analysis YouTube is the key to mastering the algorithm. These tools extract signals like session starts (does your video make people stay on YouTube?) and session depth (do they watch another of your videos afterward?). By analyzing these patterns, creators can receive automated edit recommendations, such as “Move the value proposition to T=10s” or “Add a pattern interrupt at T=45s to stop the 5% dip.”
Source:
3. Predictive > reactive: Forecasting performance before you publish
The most significant shift in 2026 is the move from reactive analytics to predictive video performance AI. Historically, creators had to publish a video and wait 48 hours to see if it “flopped.” Today, AI video performance prediction tools allow you to simulate the audience’s reaction before hitting the ‘Publish’ button.
These video engagement prediction tools utilize regression and classification models trained on billions of data points across various Indian niches—from tech reviews in Hindi to lifestyle vlogs in Tamil. By uploading a script, a storyboard, or even just the first 30 seconds of a draft, the AI can forecast:
- Predicted Watch Time: An estimate of the average view duration (AVD) within a 5% margin of error.
- Hook Score: A rating of how likely the first 10 seconds are to retain viewers.
- Thumbnail CTR Prediction: Ranking different thumbnail variants based on predicted click-through rates for specific audience segments. See AI thumbnail creator insights
In 2026, predictive models in India have reached an 89% accuracy rate for 30-second retention forecasts. This allows enterprises to avoid “production waste”—the cost of producing high-budget content that fails to resonate. By calibrating these models against local language nuances and regional pacing norms, creators can ensure their content is optimized for the diverse Indian demographic.
Sources:
- Mordor Intelligence: Global AI Video Analytics Market Outlook 2026
- TrueFan AI: AI Video Analytics for Indian Marketers
4. The 2026 Indian stack: Dashboards, APIs, and scale
For a video analytics dashboard Indian creators can rely on, the stack must be unified. A fragmented workflow where heatmaps are in one tool and predictive scores are in another is no longer viable. The modern Indian stack consists of three layers:
- The Visualization Layer: A unified dashboard featuring retention heatmaps, drop-off markers with event annotations (e.g., “Text Overlay Appeared”), and real-time CTR tracking.
- The Integration Layer (APIs): Seamless data flow between YouTube/Instagram APIs and internal BI tools. This is crucial for enterprises that need to align video performance with sales data.
- The Compliance Layer: With the full implementation of India’s Digital Personal Data Protection Act (DPDPA), tools must ensure data residency and consent-first tracking.
Studio by TrueFan AI’s 175+ language support and AI avatars play a pivotal role in this stack. By allowing creators to generate multiple versions of a video in different regional languages, it provides the “variants” needed to feed the analytics engine. For example, a brand can use the dashboard to see that their Marathi version has a higher drop-off than the Bengali version, and then use the API to instantly generate a revised Marathi hook to test for better retention.
For a video analytics dashboard Indian creators built for enterprise scale can rely on, standardizing KPIs and attribution models ensures CFO-ready reporting.
This level of scale is what separates the top 1% of creators from the rest. By 2026, the ability to automate the “Analyze -> Predict -> Generate -> Repeat” loop has become the ultimate competitive advantage.
5. Watch time optimization AI India 2026: A practical playbook
To master watch time optimization AI India 2026, creators should follow this seven-step playbook designed for the high-velocity Indian market:
- Hypothesis and Baseline: Pull data from your last 10 videos. Use a video retention heatmap India to identify recurring “cold zones.” Is there a specific type of joke or a technical explanation that always causes a dip?
- Hook Science: Craft three different intros for your next video. Use predictive video performance AI to score them. Select the top two for an A/B test. In 2026, the “Value Prop” must be delivered within the first 8 seconds for long-form content.
- Pattern Interrupts: The Indian mobile viewer is easily distracted. Insert a visual or auditory “interrupt” every 5–7 seconds. This could be a B-roll cut, a text pop-up, or a change in camera angle.
- Chaptering and Promise-Delivery: Use AI viewer behavior analysis YouTube to see if viewers are skipping to specific chapters. Ensure your chapter labels are clear and that the content in those chapters delivers on the “promise” made in the title.
- Thumbnail-Retention Synergy: A high CTR is useless if it leads to an immediate drop-off (clickbait). Use video engagement prediction tools to ensure your thumbnail accurately represents the “hottest” part of your heatmap.
- Regional Localization: Don’t just translate; transcreate. Use regional references and culturally resonant B-roll. Solutions like Studio by TrueFan AI demonstrate ROI through their ability to rapidly produce these localized variants, significantly reducing the cost per minute of high-retention content.
- The 72-Hour Pivot: Monitor the heatmap for the first 72 hours post-publish. If you see a massive drop-off in the first 20 seconds, swap the thumbnail or even re-upload a version with a tighter intro.
By treating video production as an iterative science rather than a one-off “art project,” creators can see a relative lift in watch time of up to 25% within a single quarter.
6. Case Vignette: From 35% AVD to Durable Growth
To understand the power of AI video analytics heatmap tools India 2026, let’s look at a real-world scenario involving a Hindi tech reviewer channel.
The Problem:
The channel was producing high-quality 8-minute reviews but was stuck at a 35% Average View Duration (AVD). The subscriber count had plateaued, and the YouTube algorithm had stopped suggesting their videos.
The Diagnostic:
Using a viewer attention heatmap video creator, the team discovered a “deep freeze” (massive drop-off) between 0:00 and 0:25. The creator was spending too much time on a generic channel intro and a sponsor shout-out before showing the actual product. Conversely, “heat spikes” were seen during hands-on benchmark tests and price comparisons.
The Intervention:
- Cold Open: The team moved the sponsor mention to the 60% mark. They started the video with a 5-second “Why this phone matters” hook.
- Visual Variety: They increased the frequency of B-roll cuts based on the heatmap’s “cool zones.”
- Predictive Selection: They used engagement scoring AI video India to choose between two different thumbnail styles—one focusing on the camera lens and one on the price tag. The AI predicted the price tag would perform better with the target Tier 2 city demographic.
The Outcome:
Within 30 days, the channel saw an 18% relative lift in 30-second retention. The AVD increased from 35% to 47%, triggering the YouTube “Suggested” algorithm. This resulted in a 12% increase in total watch time and a 1.8-point jump in CTR. This case proves that when you stop guessing and start measuring with heatmaps, growth becomes predictable.
7. Implementation, Compliance, and FAQs
Implementing a high-end analytics stack requires a structured approach. For Indian enterprises, this is typically a 90-day journey:
- Days 0–30: Connect platform APIs and establish a baseline. Define your “Edit List” taxonomy so you can categorize why certain segments fail (e.g., “Too much jargon,” “Bad lighting”).
- Days 31–60: Launch your video analytics dashboard Indian creators can use to view heatmap overlays. Begin A/B testing hooks using AI-generated variants.
- Days 61–90: Scale to multi-language versions. Implement automated “Re-Thumbnailing” triggers for videos where CTR falls below a specific benchmark.
Next Steps
The era of “upload and pray” is over. To dominate the Indian digital space in 2026, you need to see what your audience sees. By integrating AI video analytics heatmap tools India 2026 into your workflow, you can ensure every second of your content is engineered for maximum impact.
- Book a demo to see a professional video analytics dashboard Indian creators workflow in action.
- Download the watch time optimization AI India 2026 blueprint to start your 90-day implementation.
- Explore how AI-driven variants can transform your retention strategy.
Frequently Asked Questions
How do viewer attention heatmaps differ from standard retention graphs?
Standard retention graphs show you how many viewers remain at a certain time. Heatmaps reveal the intensity of attention—rewatches, pauses, and skips—so you can pinpoint “value spikes” to repurpose into Shorts or Reels.
What accuracy should I expect from predictive video performance AI?
In 2026, top-tier models deliver roughly 85–90% accuracy for retention forecasts. Calibrate models by language, category, and audience to achieve reliable predictions for your niche.
Is this technology compliant with India’s DPDPA?
Yes—when using enterprise-grade platforms that enforce data residency, consent-first tracking, and security controls. Certifications like ISO 27001 and SOC 2, as implemented by Studio by TrueFan AI, help meet Indian compliance standards.
Can I apply these heatmap insights to YouTube Shorts?
Absolutely. For Shorts, the first 1–3 seconds determine success. Heatmaps for vertical video surface the exact millisecond users swipe away, enabling tighter hooks and micro-pattern interrupts. Learn more about automation for Shorts in our Shorts automation guide.
How does AI behavior analysis help with “Hinglish” content?
AI viewer behavior analysis YouTube tools trained on code-switching patterns detect confusion drop-offs when switching between Hindi and English, guiding script adjustments for segment-specific retention.